Our Proof of Concept Journey:
Detail the journey of developing the R Shiny proof of concept. Include the following subheadings:
1. Identifying the need:
The development of the proof of concept stemmed from a pressing business problem: the need for enhanced data visualization and analysis capabilities. The company recognized that traditional methods of presenting and analyzing data were inefficient and lacked interactivity. Stakeholders struggled to gain actionable insights from the data due to its complexity and the limitations of existing tools.
Furthermore, there was a growing demand for real-time data analysis and visualization to support decision-making processes. The company recognized the importance of staying ahead of the competition by leveraging data-driven insights to drive strategic initiatives and optimize operations.
To address these challenges and capitalize on the opportunity to gain a competitive edge, the decision was made to explore the implementation of an interactive data visualization platform. This platform would empower stakeholders to interact with data in real-time, uncovering trends, patterns, and actionable insights that were previously inaccessible.
Thus, the development of the proof of concept for an R Shiny application was initiated with the aim of demonstrating the potential of interactive data visualization in addressing the company’s business challenges. The proof of concept would serve as a foundation for further investment and the development of a comprehensive data visualization solution tailored to the company’s specific needs and objectives.
2. Planning and Design:
In planning and designing the development process for our R Shiny proof of concept, we began with an initial assessment to understand the business problem and set clear project goals. We conducted extensive research to explore potential solutions and technologies, followed by collaborative requirements gathering to capture stakeholder needs and preferences. Through an iterative design process, we developed wireframes and prototypes, soliciting feedback to refine the design. Concurrently, we planned the technical architecture, considering scalability, performance, security, and integration requirements. Throughout, we conducted ongoing risk assessment and mitigation and prioritized documentation and communication to ensure transparency and alignment with stakeholders. This comprehensive approach ensured that the development process was well-informed, collaborative, and positioned for success.
3. Development Process:
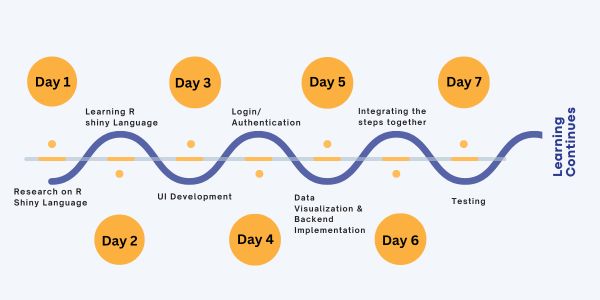
During the development of our proof of concept, we meticulously followed these steps:
Research on R Shiny Language:
We conducted thorough research on R Shiny, delving into its syntax, features, and available libraries for developing interactive web applications. This step allowed us to gain a solid understanding of the technology’s capabilities and potential applications.
UI Development for Login, Dashboard:
Leveraging R Shiny’s layout functions, particularly shiny dashboard layout, we meticulously designed user interfaces for login/authentication and interactive dashboards. This involved structuring the layout, arranging components, and ensuring an intuitive user experience.
Data Visualization and Backend Implementation:
We utilized R’s powerful data visualization libraries, including plotly shiny R, to create interactive charts and graphs that visualize the underlying data effectively. Simultaneously, we implemented backend functionality using R functions and packages for data manipulation and analysis, ensuring seamless data processing.
Integrated Frontend and Backend:
Employing reactive programming concepts in R Shiny, we seamlessly integrated UI elements with backend logic. This ensured dynamic interaction between user inputs and data processing, enhancing the overall interactivity and responsiveness of the application.
Testing:
Finally, we conducted comprehensive testing of the application to validate its functionality, responsiveness, and user experience. Through rigorous testing, we addressed any bugs or performance issues, ensuring a smooth and seamless user experience.
By meticulously following these steps, we successfully developed a proof of concept using R Shiny, demonstrating its effectiveness in creating interactive web applications for data visualization and analysis.
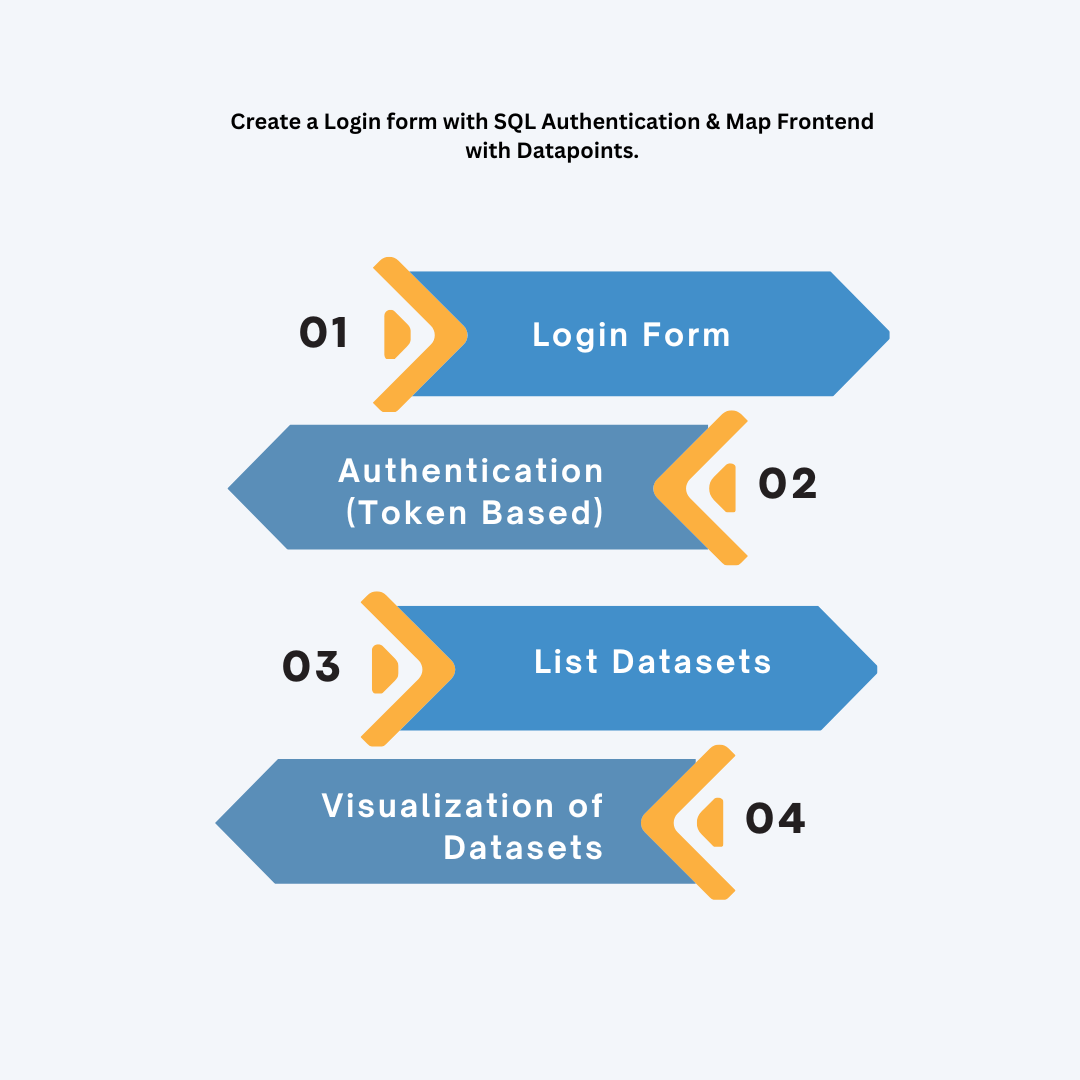
In our R Shiny proof of concept development, we utilized a diverse range of libraries to construct a robust and dynamic application. Leveraging tools like shiny, shiny.router, and shinyjs, we engineered a seamless login form with token-based authentication for secure user access. Our Dashboard UI was enriched with interactive visualizations using leaflet, plotly, and ggplot2, empowering users with deeper data exploration capabilities. Additionally, by employing RPostgreSQL, readr, and dbplyr, we enabled users to access and analyze datasets efficiently, streamlining data management tasks. Through the integration of these libraries, our proof of concept showcased the versatility and efficacy of R Shiny in crafting sophisticated and user-friendly applications tailored for data analysis and visualization.
4. Key Features:
The key features of the R Shiny application developed in the proof of concept include interactive dashboards for dynamic data exploration, real-time data updates, customizable user interfaces, seamless integration with backend systems, data export capabilities, and robust security measures. Additionally, the application offers a range of visualization options, including charts, graphs, and maps, to facilitate deeper insights. It enables users to efficiently manage and manipulate datasets, empowering data-driven decision-making across the organization. Overall, these features demonstrate the versatility and effectiveness of R Shiny in building sophisticated and user-friendly applications for data analysis and visualization.
5. Challenges Faced:
Quite a few challenges are good during the production of the R Shiny proof of concept, primarily stemming from the team’s lack of previous experience in R Shiny. Overcoming this hurdle required grappling with the concepts, syntax, and language peculiarities of the R programming language. Additionally, the team encountered difficulties related to data visualization, such as effectively translating data into meaningful visual representations within the Shiny framework. Furthermore, navigating the vast array of libraries and ensuring compatibility with the appropriate versions posed challenges, requiring meticulous attention to detail and thorough testing to overcome. Despite these obstacles, Imperial persevered, leveraging their growing understanding of R Shiny and the R language to successfully deliver the proof of concept.
6. Success Metrics:
R Shiny offers several benefits for data visualization and analytics projects. Firstly, it provides a seamless integration of R’s powerful statistical and graphical capabilities into interactive web applications, enabling users to create dynamic visualizations with minimal coding knowledge. This empowers businesses to develop customized dashboards, reports, and tools tailored to their specific needs.
Moreover, R Shiny facilitates real-time data analysis and visualization, allowing businesses to make informed decisions quickly based on the latest insights. For example, companies can build interactive dashboards to monitor key performance indicators (KPIs) in real-time, enabling timely adjustments to strategies and tactics.
Additionally, R Shiny enhances collaboration and communication by enabling stakeholders to interact with data directly, fostering a deeper understanding of complex datasets and facilitating data-driven decision-making across departments and teams. Overall, R Shiny adds significant value to businesses by democratizing access to data insights and empowering users to extract actionable intelligence from their data.
7. Future Opportunities:
Potential future opportunities for leveraging R Shiny within the organization include expanding its use to other departments for diverse applications such as marketing analytics, operations optimization, and customer relationship management. Additionally, the proof of concept could be further developed into a fully-fledged solution by integrating additional features such as predictive analytics, machine learning algorithms, and advanced data visualization techniques. This could enable the organization to gain deeper insights into customer behavior, improve decision-making processes, and drive innovation across various business functions. Furthermore, R Shiny could be utilized for external-facing applications, such as creating interactive data portals for clients or stakeholders, enhancing transparency and communication.
8. Conclusion:
In summary, R Shiny presents a sturdy framework for crafting interactive web applications, especially suited for data analysis and visualization tasks. While its user-friendliness and utilization of R’s capabilities are commendable, it may have constraints in terms of customization. Nonetheless, avenues for advancement lie in enhancing scalability and integration. By adhering to structured steps encompassing research, UI development, backend implementation, integration, and testing, organizations can harness R Shiny’s potential effectively. This enables the incorporation of features like login forms, authentication mechanisms, dashboards, dataset manipulation functionalities, and dynamic data visualizations into projects.